499/- only for first 100 traders

Get Unfair advantage in market!

! Premium Indicator Worth 3000/- Only for 499!

See How Our Indicator Transforms Your Trading Experience πŸ‘‹πŸΌ

What Traders Are Saying About PACPL Momentum Grid

Real feedback from traders who’ve used the indicator in live market conditions. These are their experiences after real usage – not theory, not promises.

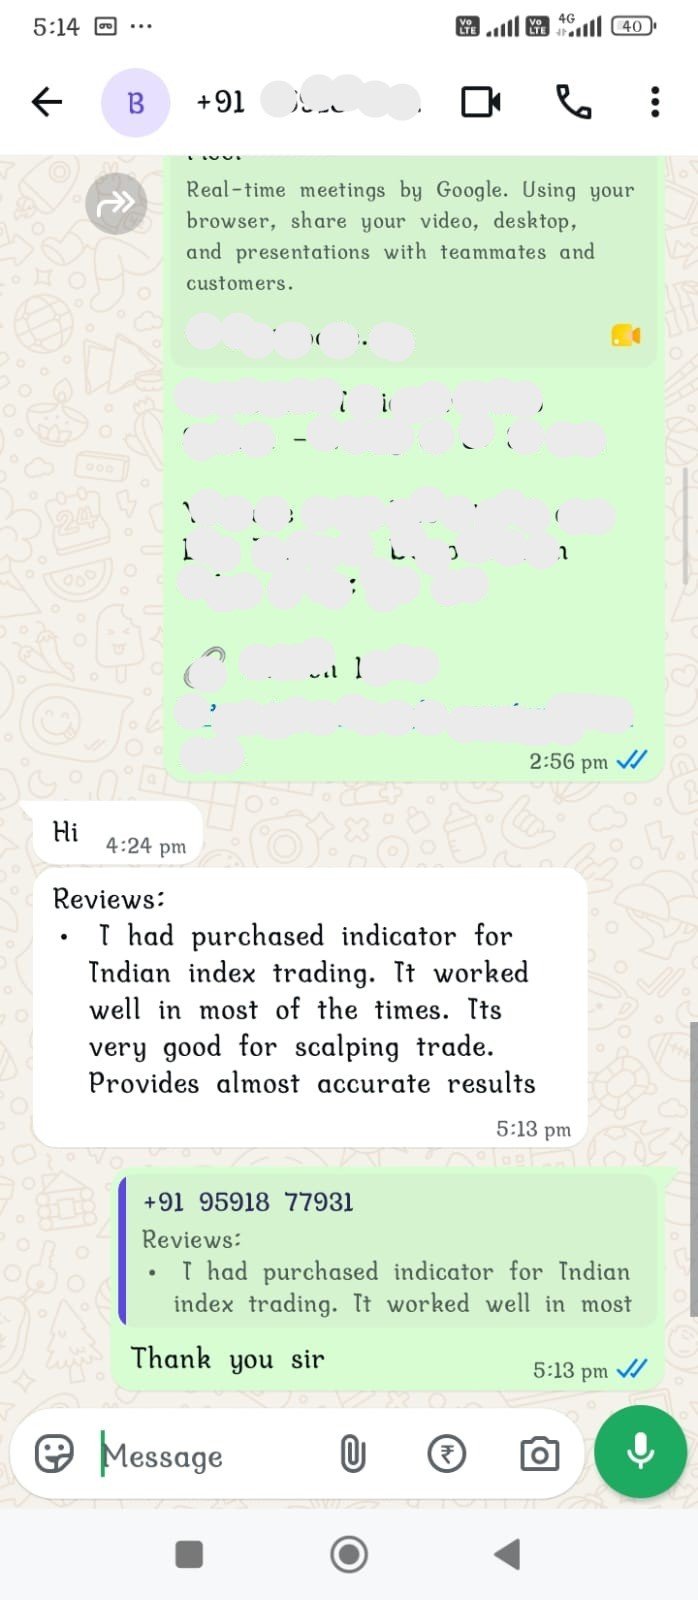
I found the interface simple and the indicator useful for studying market trends.

Rahul Thapa
9 Days After purchase ⭐⭐⭐⭐⭐

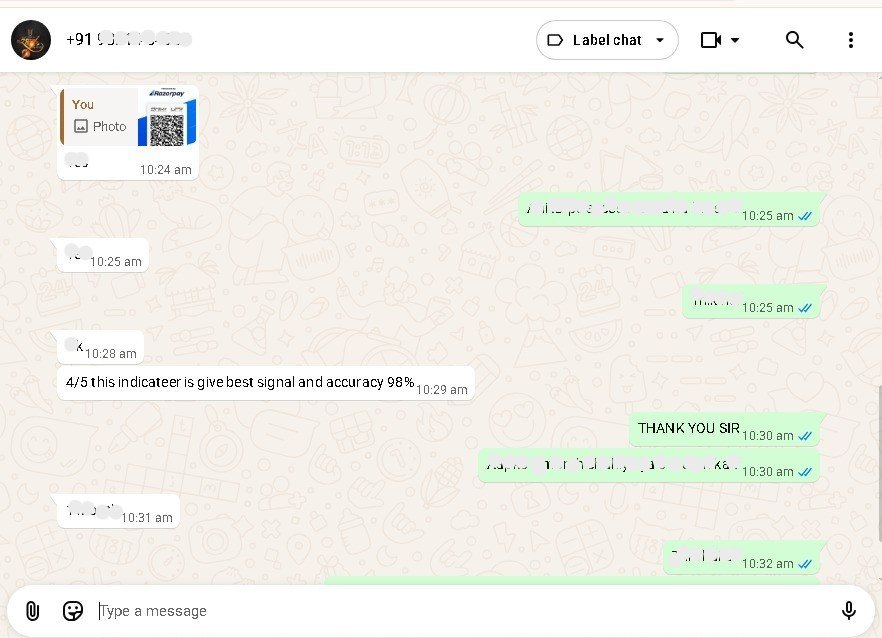
I tried many indicators before, but none of them really worked for me. This one is actually one of the best I’ve used till now. The signals make sense, entries and exits are clear, and it performs well in real market conditions.

Ramesh Panchal
6 Days After purchase ⭐⭐⭐⭐⭐

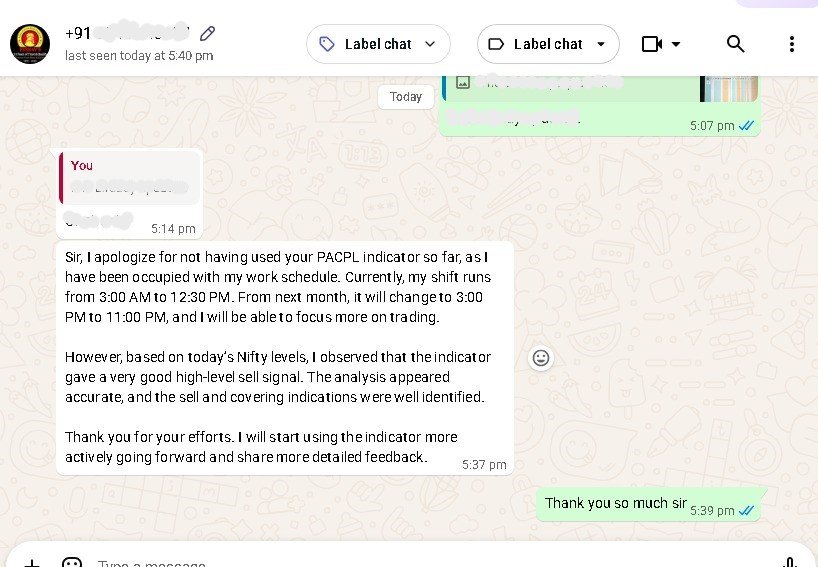
This indicator has brought a lot of confidence to my trading. It makes my decision making more strong.

Suresh Shah
8 Days After purchase ⭐⭐⭐⭐⭐

Track Real-Time Data to Make Informed, Confident TradesπŸ‘‹πŸΌ

2000+ Active Trader

Live Market Insights
with PACPL Momentum Grid

After
Before

This one indicator is equal to 125+ Indicator

4.8/5 ⭐⭐⭐⭐⭐

Pacpl Indicator Provide indicator for all markets

Realtime Market Insights in this Indicator

Realtime Market Insights in this Indicator

Realtime Market Insights in this Indicator

All Critical Insight at One Place

Live EMA & Oscillator Data

Real-time trend clarity - bullish, bearish, or sideways.

Market Phase Dashboard

Instant view of trend, consolidation, or reversal.

Support & Resistence

Track key stocks driving index movement.

Track Market Conditions in Real-Time

Real-Time Market Condition

Get immediate updates on whether the market is bullish, bearish, or sideways, helping you decide when to enter or exit trades.

Clear Indicators

UWith easy-to-understand indicators, the Market Phase Dashboard ensures you’re always aligned with the market’s current phase.

Instant Alerts

Receive quick alerts when the market shifts, enabling you to act fast and make informed decisions without delay.

Perfect for Scalpers & Intraday Traders

The Market Phase Dashboard is especially useful for scalpers and intraday traders, giving them the edge to trade in volatile market conditions.

Never Miss the Perfect Trade with PACPL's Real-Time Signals πŸ‘‹πŸΌ

Clear Entry Visual Signals for Confident Trading

The PACPL Momentum Grid delivers real-time entry signals to help you execute trades at the most optimal moments. With clear green BUY and red SELL signals, you’ll know exactly when to enter or exit the market.

How the Visual Indicators Work

🟒 Green Triangle (below candle)

Indicates a bullish market condition based on the tool’s internal calculations.

πŸ”΄ Red Triangle (above candle)

Indicates a bearish market condition based on the tool’s internal calculations.

How to Access Your PACPL Momentum Grid Indicator

Get started with our easy 5-step process and start trading with precision

Follow these simple steps to purchase and get full access to the PACPL Momentum Grid Nifty Indicator. From the moment you make the purchase, our team will guide you through each step to ensure smooth access on TradingView.

Step 1

Purchase the indicator & at the end You will receive a WhatsApp link to connect with our team.

Step 2

Our team will contact you via call or message to confirm your preferred asset class (Nifty 50, Crypto, or Stocks).

Step 3

Our team will ask for your full name and TradingView ID to grant indicator access.

Step 4

Our team will provide you with access to the indicator on your TradingView ID.

Step 5

You will be added to our official community group for updates and support.

How to Use This IndicatorπŸ‘‹πŸΌ

For Beginners:

  • Use only 2 to 3 Signal per Day.
    Avoid in Choppy Sideways Market.
  • Use timeframe 3 min.
  • Select option Strike price as per comfort.
  • In option trading always focus on profit Booking and option SL Points deside as per your risk.

Β 

Risk Management Features

  • Automatic Stop Loss: Protects capital
  • Take Profit Target: Locks in gains
  • Session Filter: Avoids overnight risk and low-liquidity periods

Follow These Guidelines for Optimal Performance with PACPL Momentum Grid πŸ‘‹πŸΌ

Do's and Don'ts for Maximizing Your Trading Success

To make the most of the PACPL Momentum Grid, follow these best practices and avoid common pitfalls. This guide will help you get the most consistent and profitable results from your trades.

Do’s:

βœ… Do Use 2-3 Signals Per Day:
“For best results, limit your trades to 2-3 high-confidence signals per day. Focus on quality, not quantity.”

βœ… Do Use on Volatile, Trend-Following Markets:
“PACPL Momentum Grid works best during trending markets. Look for clear market direction before entering a trade.”

βœ… Do Follow Risk Management Features:
“Always use the stop-loss and take-profit features to protect your capital and lock in profits automatically.”

βœ… Do Backtest and Paper Trade:
“Before trading live, practice with paper trading to get familiar with the signals and risk management settings.”

Don’ts:

❌ Don’t Trade During Major News Events:
“Avoid trading during high-impact news events that can cause unpredictable market movements and affect the signals.”

❌ Don’t Rely on 1-Minute Timeframes:
“PACPL Momentum Grid is optimized for 2- or 3-minute timeframes. Avoid using shorter timeframes like 1-minute as they may give unreliable signals.”

❌ Don’t Ignore Market Conditions:
“Always check the Market Phase Dashboard to ensure you’re trading in the right market conditions (bullish, bearish, or sideways).”

❌ Don’t Hold Positions Without Monitoring:
“While the tool helps manage risk, it’s still important to monitor your trades, especially in fast-moving markets.”

Get Started with PACPL Momentum Grid and Elevate Your Trading!

The Indicator Plan

No hidden fees, just straightforward pricing for a powerful tool that can enhance your trading experience.

Momentum Grid

PACPL
1000 499
/Month
Real-time Entry Signals
Risk Management (Stop-Loss & Take-Profit)
Full Access to Market Phase Dashboard
1 Month of Full Support
Save 70%

FAQ Question ❓

Frequently Asked Questions

Have questions about the PACPL Momentum Grid Nifty Indicator? We’ve compiled answers to the most commonly asked questions to help you get the most out of this powerful trading tool. If you need further assistance, feel free to reach out!

Yes! The PACPL Momentum Grid is designed to be easy to use for both beginners and experienced traders. With real-time signals, clear entry points, and built-in risk management, it’s perfect for anyone looking to improve their trading performance.

The PACPL Momentum Grid is ideal for high-liquidity instruments like Nifty, but it can also be used with other similar assets in the market. It’s tailored to work best with scalping strategies.

The PACPL Momentum Grid automatically sets stop-loss and take-profit levels for each trade. This ensures that your trades are protected and your profits are locked in, even if the market moves against you.

No, the PACPL Momentum Grid is specifically designed for intraday trading and scalping. It is optimized for short-term trades and provides the best results during trending markets.

The PACPL Momentum Grid is compatible with desktop trading platforms. While mobile versions of your trading platform may be available, it is recommended to use the desktop version for the best experience and full functionality.

This script is for educational purposes only. It is not financial advice. Trading involves risk, and past performance does not guarantee future results. Use at your own risk.

499/- only for first 100 traders