Market Trend Dashboard – Overview
This dashboard provides a real-time summary of selected stocks based on trend direction and momentum strength.
Symbol – The stock name (NSE listed).
Trend – Indicates the overall market direction (Bullish or Bearish).
Momentum – Shows the strength of the current move (Strong or Weak).
Action – Suggested trading stance:
Sell – Strong bearish trend with confirmed downside momentum.
Wait – Weak momentum; confirmation required before taking a position.
Currently, most stocks are showing a Bearish trend, and those with Strong momentum are generating Sell signals, indicating sustained downward pressure.
This dashboard helps traders quickly identify trend strength and take informed decisions based on structured market analysis.
Fundamental Snapshot – Company Overview
This section highlights the key financial metrics of the company:
Market Cap: 1,886.77 Billion – Indicates a large-cap company with strong market presence.
Earnings Yield: 4.41% – Reflects the return generated on the current share price.
P/E Ratio: 22.67 – Shows how much investors are willing to pay per unit of earnings.
Price to Sales Ratio: 1.84 – Compares company valuation to its revenue.
Dividend Yield: 0.39% – Indicates a modest dividend payout.
Latest Earnings: Data currently unavailable.
Overall, the company appears to be a large-cap stock with moderate valuation levels and stable fundamentals, making it suitable for long-term investors monitoring earnings efficiency and valuation metrics.
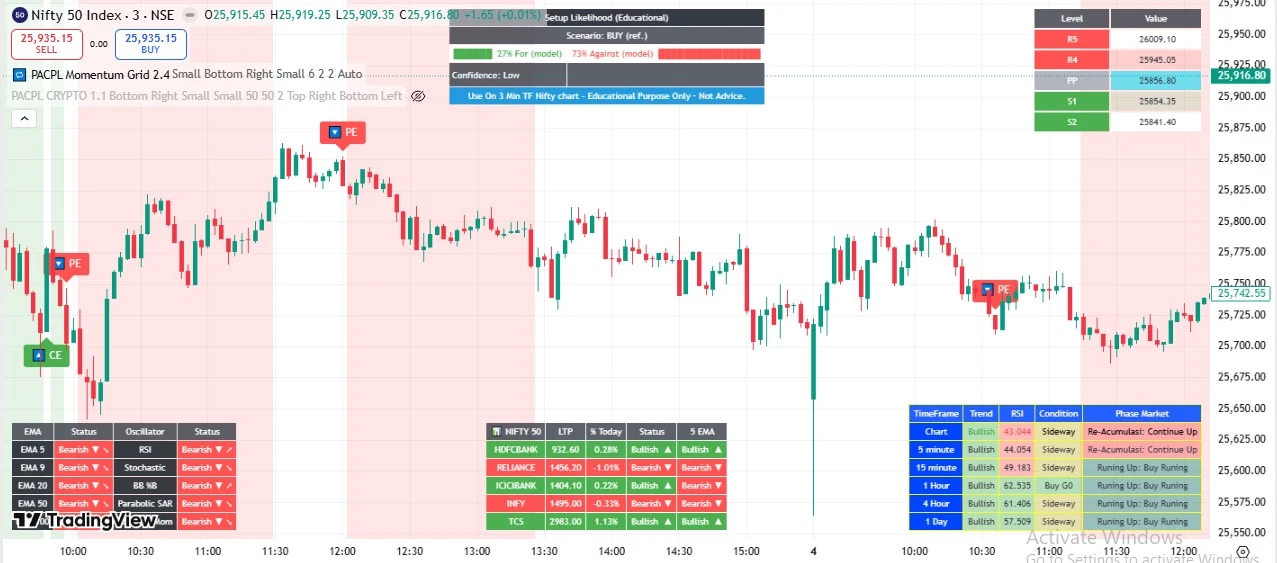
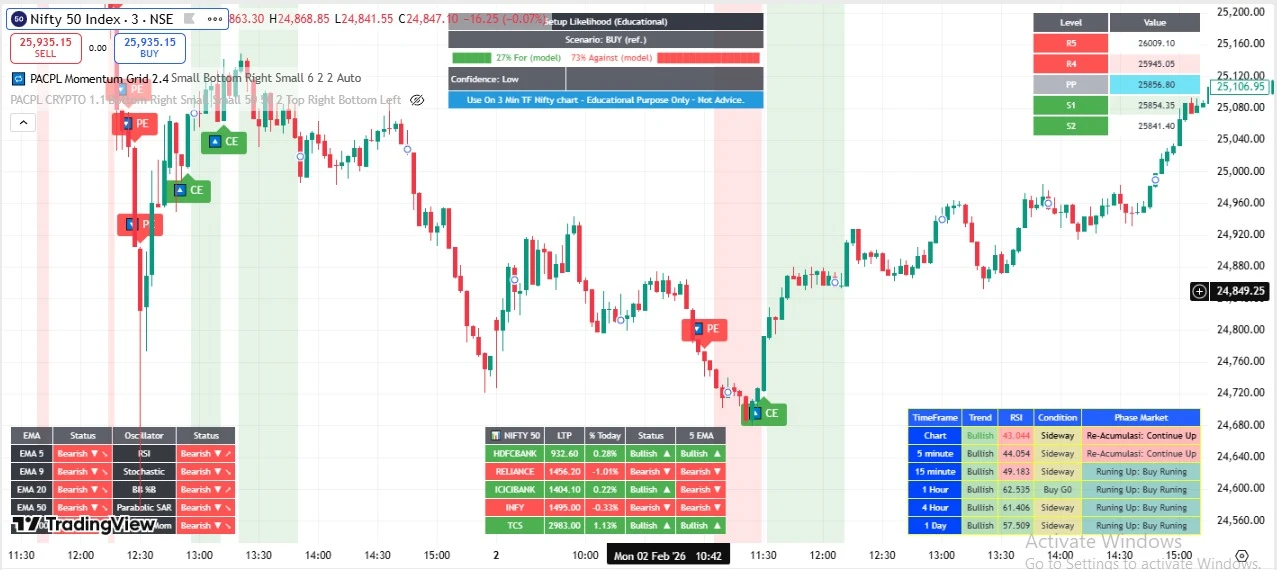
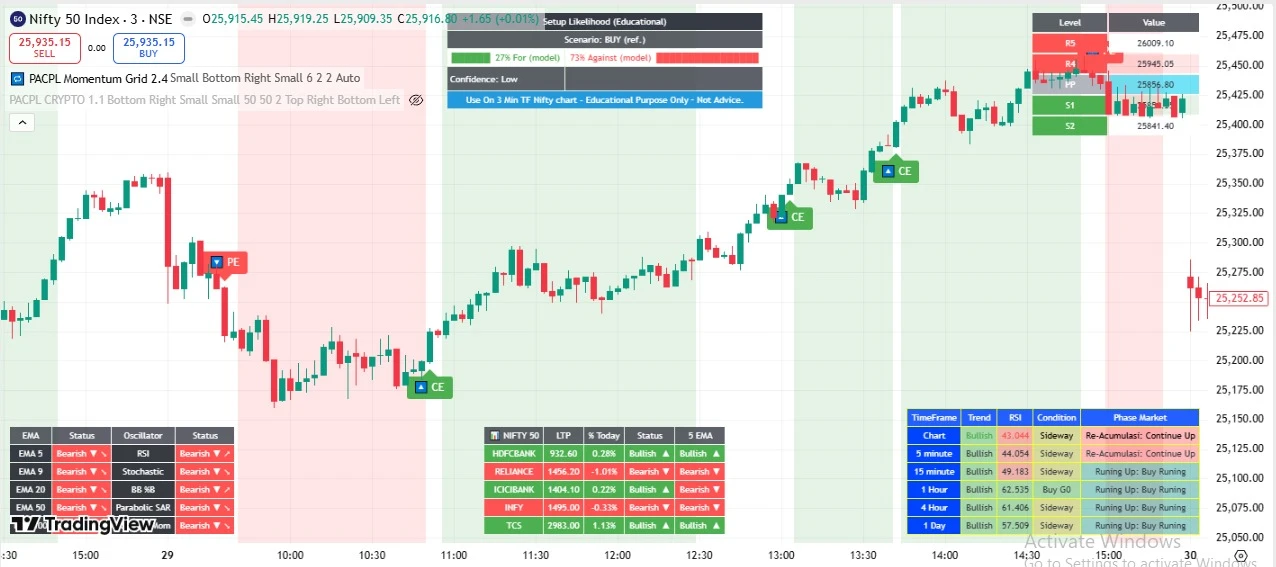
Support is a price level where the market tends to stop falling and may bounce back up. It happens because buyers become stronger than sellers at that level, creating demand. In your chart, the green line areas act as support where price slows down or reverses upward.
Resistance is a price level where the market tends to stop rising and may reverse downward. This happens because sellers become stronger than buyers, creating supply. On your chart, the red line areas show resistance where price struggles to move higher.
In simple terms:
Support = Floor (price tends to bounce up)
Resistance = Ceiling (price tends to fall down)
Traders use these levels to plan entries, stop-loss, and take-profit points.
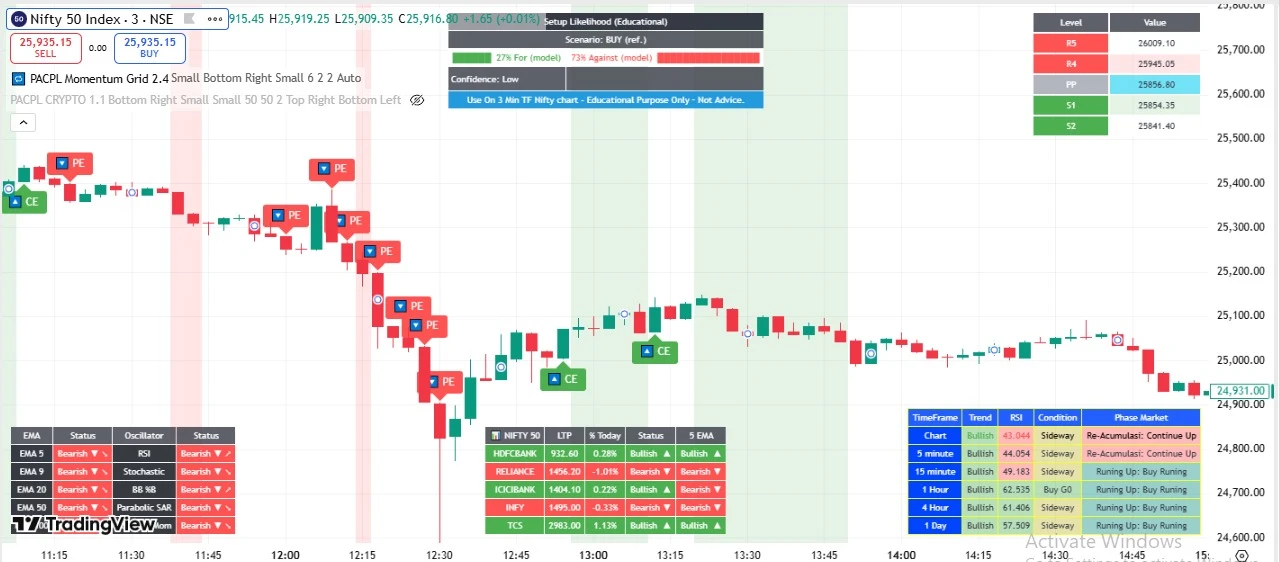
Price Chart (Center)
Real-time candlestick chart.
Shows market trend (currently bearish with sharp drop).
Helps visualize entry, trend strength, and volatility.
Buy/Sell Panel (Top Left)
Displays instant SELL and BUY price buttons.
Used for quick manual order execution.
Trade Commander Dashboard (Top Right)
How This Dashboard Is Helpful
It shows real-time daily performance of major indices:
Index | Trend |
NIFTY | Negative |
SPX (S&P 500) | Negative |
DAX | Strong Negative |
Nikkei 225 | Negative |
BankNifty | Negative |
Observation:
All major global indices are trading in red (negative % change).
This indicates global bearish sentiment.
This helps traders:
Here’s how we deliver Pine Script development & automation, inspired by the referenced vendors but customised for your PACPL brand and target audience (Indian retail + algo-marketplaces).
• We engage with you to capture your trading logic: conditions for entries/exits, risk parameters (stop-loss, target, trailing), hedging, multi-leg trades, time-frames, instruments (e.g., Nifty options, stocks, MCX, etc.).
• Define environment assumptions: intraday vs positional, data frequency, broker linkage, alerting mechanism.
• Estimate complexity → assign tier of execution (see pricing tiers below).
• Convert your logic into Pine Script: custom indicator or full strategy (with built-in back-test capabilities).
• Use Trading View’s Strategy Tester (win-rate, drawdown, profit factor) to validate logic.
• Ensure non-repainting logic, correct handling of historical/back-test vs live.
• Provide version control and documentation of the code.
• Set up alerts on Trading View (web-hook payloads) that trigger the strategy’s signals.
• Provide integration with broker/execution tool (API/bridge) so alerts flow into live orders.
• Seamless link between Trading View & your execution platform
• Deploy the Pine Script on live charts; monitor performance in forward-testing ("paper trade") mode first.
• Provide support for minor tweaks and adjustments (parameter optimisation, logic fine-tuning).
• Provide documentation/hand-over of source code, alert instructions, and operational manual.
• For advanced clients/trading systems: Multi-leg logic, time-based/multi-symbol strategies, hedging, real-time monitoring dashboards.
• Preparing scripts for marketplace listing (e.g., Tradetron, etc.), with proper input parameters, user-friendly GUI, documentation.
To deliver efficiently, we expect you to supply:
A clear description of your trading logic (entry, exit, stop/target/management, time-frame, instruments).
Any historical performance/logic you already have (or sample trades).
Decision on automation scope: alert only? alert + broker execution? which brokers?
Desired UI/parameters: do you need user-inputs, multi-legs, hedging, re-entries?
Acceptable delivery timeline and budget.
Access to your TradingView account (or a test account) for integration/alerts.
Pine Script runs in TradingView. For full automation (order execution), we link/bridge alerts to your broker-API so trades are triggered automatically.
Yes — TradingView has in-built Strategy Tester for Pine Script. We ensure you see key stats (win-rate, drawdown, profit factor) before live deployment.
An indicator provides visual cues (plots, signals), but cannot always be used for full automation/back-test. A strategy defines explicit entry/exit rules, computes performance metrics, and is automation-ready.
Yes — we cater to Indian markets (cash/derivatives/commodities) and also global markets if required. We can build for multi-leg options, hedge strategies etc
Yes — you receive the Pine Script source code, documentation, and full control (unless otherwise agreed). We ensure proper hand-over.
We’re here to help. Reach out today and get the support you need to take your trading to the next level!
One platform combining Momentum, Reversal, and Swing indicators.
Address: 03, Signet Plaza Tower-B, Third floor, Kunal cross road, Gotri, Vadodara- 390021
WhatsApp us
Automated page speed optimizations for fast site performance