PACPL engineered a clean Pine Script architecture with clear trend confluence. Reliable execution, institutional logic, and completely zero repaint.
Crypto | Gold | Indian Index |Stock
Custom Engineered by PACPL for Client Trading Desks — showcasing the algorithmic precision, multi-timeframe filters, and zero-repaint architecture we build for professional traders.


Feedback from traders using custom algorithmic systems engineered by PACPL.
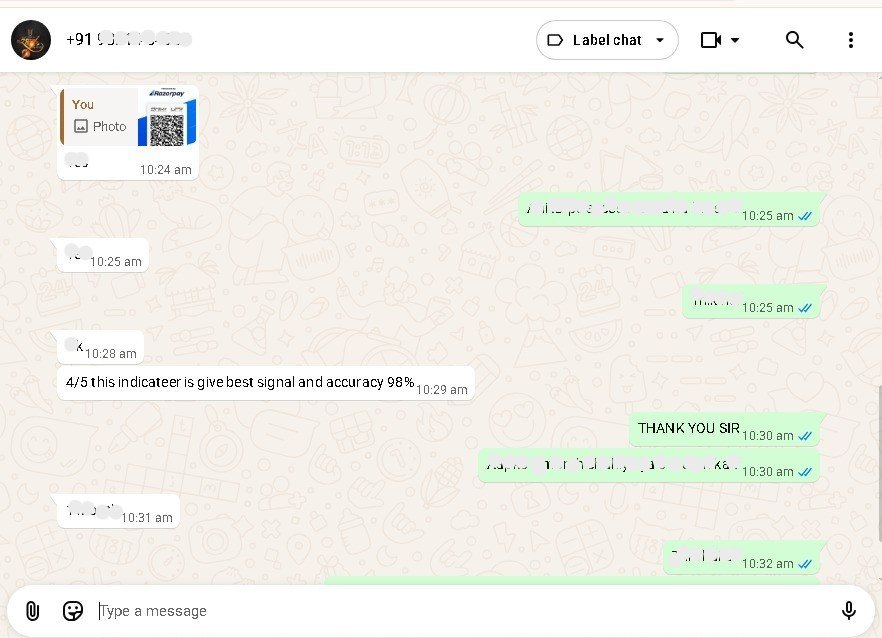
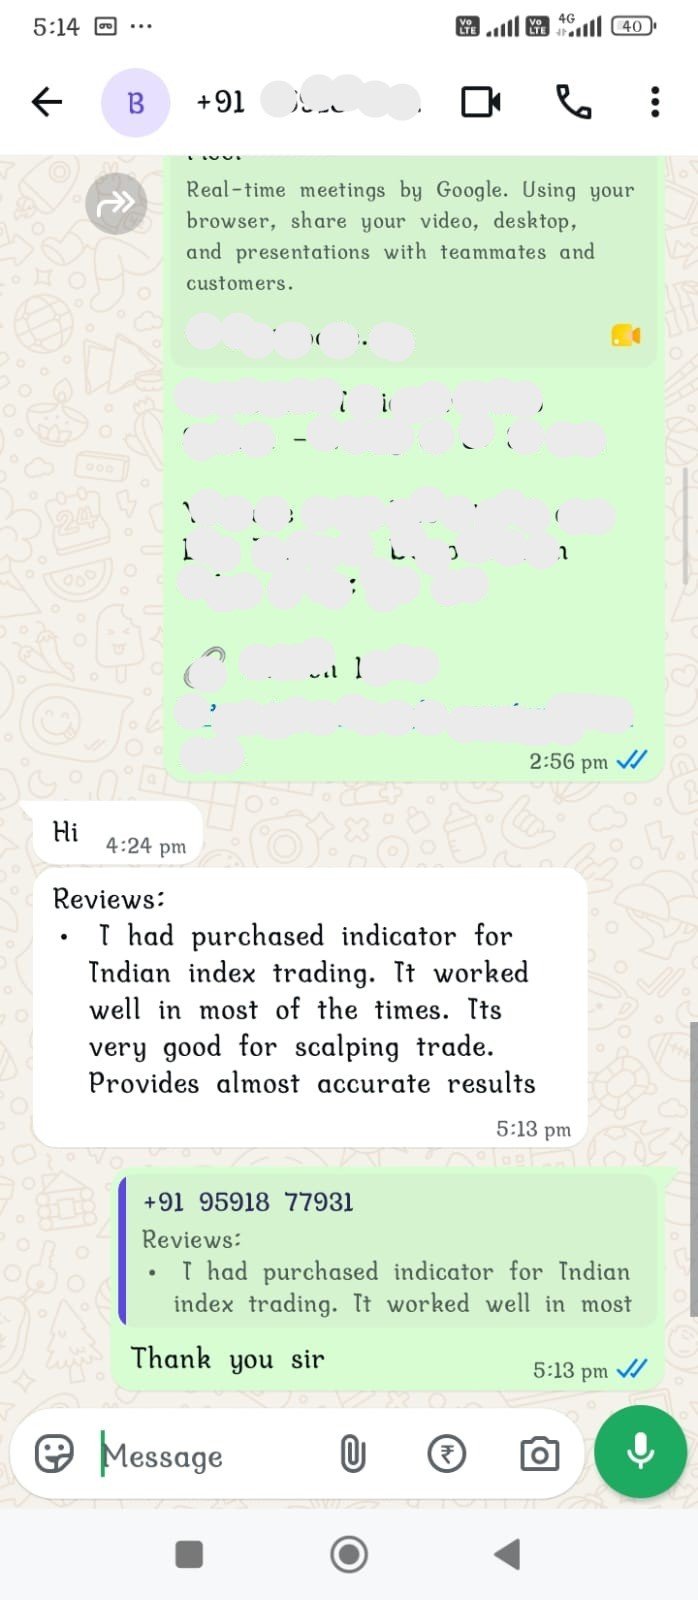
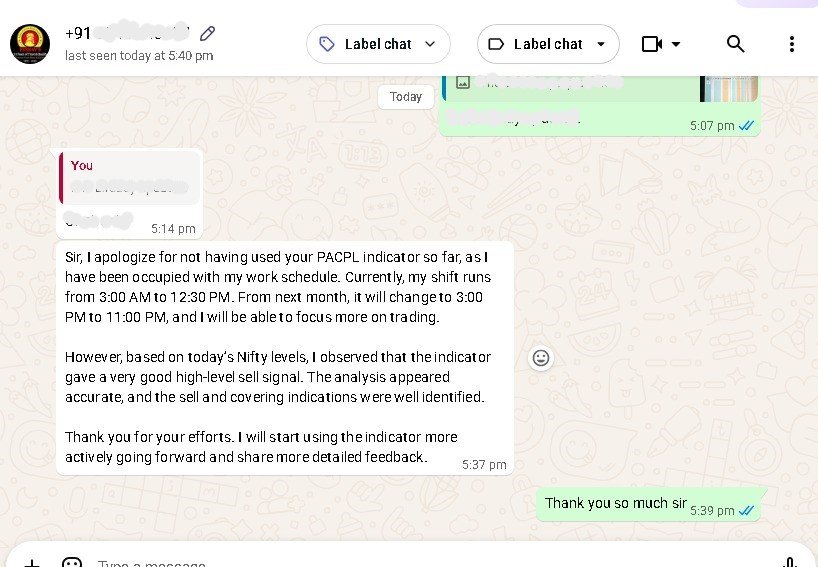



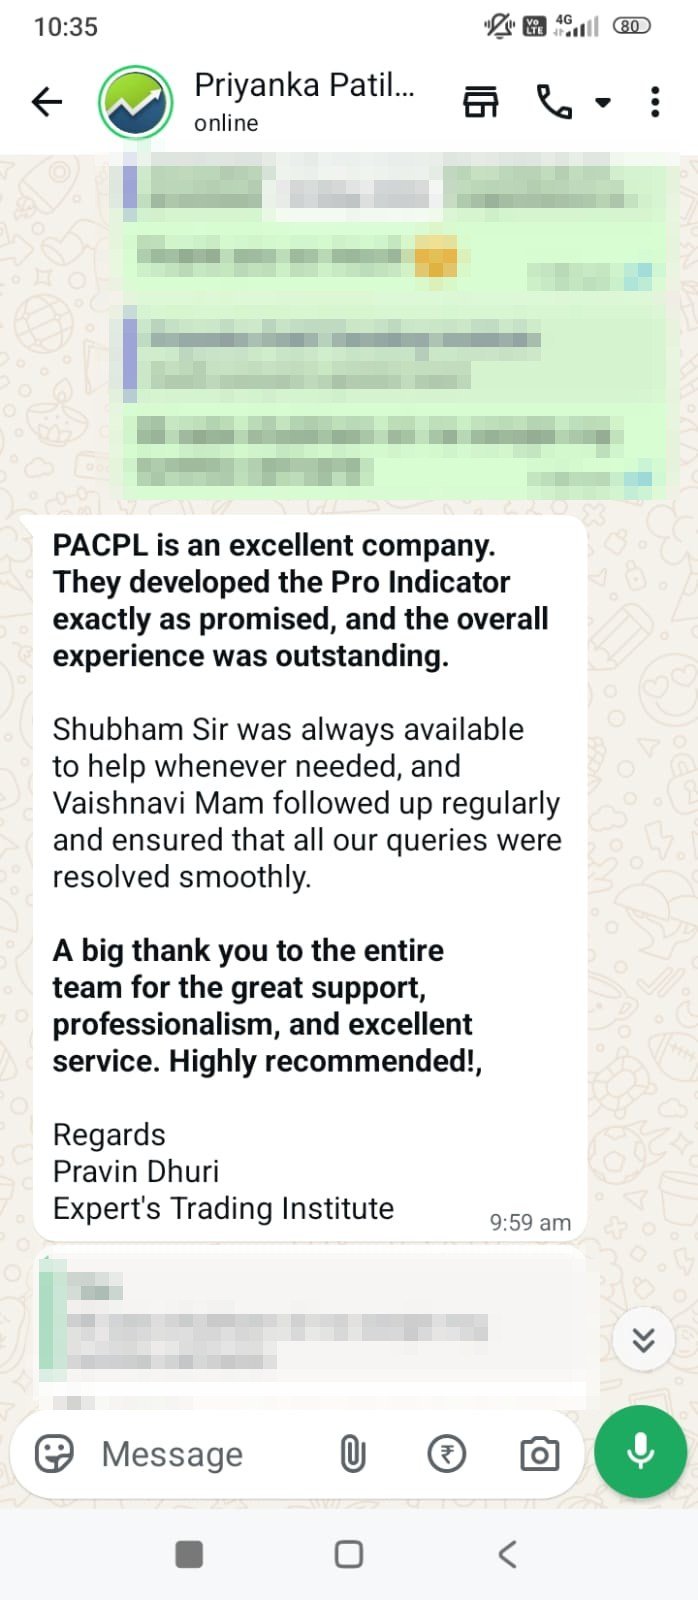
Real feedback from traders running custom quant solutions in live market conditions. These are their experiences after real production execution.
PACPL engineered a clean Pine Script architecture with clear trend confluence. Reliable execution, institutional logic, and completely zero repaint.

I evaluated various scripts before commissioning PACPL. Their custom momentum logic delivers exactly what our strategy required: clear signals, strict close-based confirmation, and institutional precision.
The custom algorithmic system engineered by PACPL brought disciplined risk management and precision to our trading desk. Full code ownership and flawless handover.
Real-time trend clarity - bullish, bearish, or sideways.

Instant view of trend, consolidation, or reversal.

Track key stocks driving index movement.


Get immediate updates on whether the market is bullish, bearish, or sideways, helping you decide when to enter or exit trades.

UWith easy-to-understand indicators, the Market Phase Dashboard ensures you’re always aligned with the market’s current phase.
Receive quick alerts when the market shifts, enabling you to act fast and make informed decisions without delay.
The Market Phase Dashboard is especially useful for scalpers and intraday traders, giving them the edge to trade in volatile market conditions.
Engineered with multi-timeframe momentum filters, the Momentum Grid architecture was custom-developed to provide client traders with clear, rule-based execution entries across volatile Indian indices.
Indicates a bullish market condition based on the tool’s internal calculations.
Indicates a bearish market condition based on the tool’s internal calculations.


When developing this indicator architecture, our engineering team integrated strict validation rules to eliminate noise and maximize execution consistency for client portfolios.
✅ Do Use 2-3 Signals Per Day:
“For best results, limit your trades to 2-3 high-confidence signals per day. Focus on quality, not quantity.”
✅ Do Use on Volatile, Trend-Following Markets:
“This custom Pine Script architecture was engineered specifically for trending markets. Look for clear market direction before entering a trade.”
✅ Do Follow Risk Management Features:
“Always use the stop-loss and take-profit features to protect your capital and lock in profits automatically.”
✅ Do Backtest and Paper Trade:
“Before trading live, practice with paper trading to get familiar with the signals and risk management settings.”
❌ Don’t Trade During Major News Events:
“Avoid trading during high-impact news events that can cause unpredictable market movements and affect the signals.”
❌ Don’t Rely on 1-Minute Timeframes:
“The client setup was custom-optimized for 2- or 3-minute timeframes. Avoid using shorter timeframes like 1-minute as they may give unreliable signals.”
❌ Don’t Ignore Market Conditions:
“Always check the Market Phase Dashboard to ensure you’re trading in the right market conditions (bullish, bearish, or sideways).”
❌ Don’t Hold Positions Without Monitoring:
“While the tool helps manage risk, it’s still important to monitor your trades, especially in fast-moving markets.”
100% source code ownership, zero recurring fees, and bespoke algo engineering tailored precisely to your trading rules.
PACPL Bespoke Development Desk
Frequently asked questions regarding how PACPL custom-develops bespoke trading indicators and quantitative software for clients:
Yes! The PACPL Momentum Grid is designed to be easy to use for both beginners and experienced traders. With real-time signals, clear entry points, and built-in risk management, it’s perfect for anyone looking to improve their trading performance.
The PACPL Momentum Grid is ideal for high-liquidity instruments like Nifty, but it can also be used with other similar assets in the market. It’s tailored to work best with scalping strategies.
The PACPL Momentum Grid automatically sets stop-loss and take-profit levels for each trade. This ensures that your trades are protected and your profits are locked in, even if the market moves against you.
No, the PACPL Momentum Grid is specifically designed for intraday trading and scalping. It is optimized for short-term trades and provides the best results during trending markets.
The PACPL Momentum Grid is compatible with desktop trading platforms. While mobile versions of your trading platform may be available, it is recommended to use the desktop version for the best experience and full functionality.
This script is for educational purposes only. It is not financial advice. Trading involves risk, and past performance does not guarantee future results. Use at your own risk.

Custom trading automation — indicators, Expert Advisors, bots, algo systems & dashboards, built to your strategy.
Address: Shop No. 239, Samanvay Westbreeze Commercial, Opposite Sepal Residency, Gotri, Vadodara, Gujarat - 390021
Copyright © 2026 PACPL Indicators
WhatsApp us

Automated page speed optimizations for fast site performance
